By Grace Turke-Martinez, VP & Director of Analytics
Recently, The Associated Press published an article, “More than 1 million voters switch to GOP in warning for Dems”. It quickly picked up traction and was retweeted by Republicans as evidence of the country’s rightward shift. At The Messina Group, we pride ourselves in following the data, no matter what direction it points. So for this AP story, we asked ourselves, is this really the truth?
Let’s see what the AP wrote for starters:
“WASHINGTON (AP) — A political shift is beginning to take hold across the U.S. as tens of thousands of suburban swing voters who helped fuel the Democratic Party’s gains in recent years are becoming Republicans.”
…
“The AP examined nearly 1.7 million voters who had likely switched affiliations across 42 states for which there is data over the last 12 months, according to L2, a political data firm. L2 uses a combination of state voter records and statistical modeling to determine party affiliation, meaning that the switchers include both those who have formally changed their registration and those who L2 estimates have shifted toward the GOP.”
“The AP examined data from the 31 states in which voters explicitly register by political party and which make that information available to the public. Across those states, nearly 680,000 voters changed their registrations in the past year, according to L2, a political data firm.
While party switching is not uncommon, the data shows a definite reversal from the period while Trump was in office, when Democrats enjoyed a slight edge in the number of party switchers nationwide.
But over the last year, about 430,000 voters in those states shifted to the Republican Party, compared with about 240,000 who became Democrats. In another 12 states — including the electoral battlegrounds of Texas, Ohio and Virginia — L2 estimates each voter’s party affiliation using records of voting in primary elections or statistical modeling. Those estimates, based on information such as demographics, local voting patterns and registered voter surveys, suggest that the same pattern is playing out in these states, too, with roughly two-thirds of voters whose affiliations changed in the past year moving toward the Republican Party.”
There were a few nits I could pick with this analysis.
- The reporters discuss modeled registrations as equivalent to actual party registration for party switching. In this context, modeled partisanship is not equivalent to documented party affiliation. The authors differentiate between states with actual party registration and those with only modeled data but don’t do a good job explaining how these models were created and why modeled partisanship is different.
- Party switching is relatively rare, and we need to take into account new registrations, deaths, and movers to get a more comprehensive picture of how the electorate is changing. The authors describe party switching as “not uncommon”, but I disagree with that characterization. Party switching happens, but it is unusual.
- The authors look at the national trend, but electoral politics play out at the state and district level.
As a Democrat, there are plenty of reasons to be worried about the upcoming elections: inflation, the tendency of an incumbent president’s party to lose seats in the midterms, Biden’s low approval rating, and the enduring polarization in our society. So, we wanted to know for sure: Is this “party switchers are leaning GOP” trend real? To answer this, we looked at the data.
The Messina Group licenses voter file data from TargetSmart, and we keep historical snapshots of specific points in time for purposes like this. Using our snapshots, which date back to early 2017, I analyzed the trend of party switching and the composition of the electorate in states with party registration.
I wanted to know a few things:
- how common is party registration switching,
- how has party affiliation within the overall electorate changed over time,
- how do these changes vary state by state, and
- has there been a notable rightward shift post-2020, as the AP authors suggested.
Before I dive into my findings, I want to provide some context for this data.
First, in the United States, elections and voter registration are decentralized. Each state has its own rules and processes. Data are updated at different times and in different formats, and the voter rolls might be cleaned (or purged) at different times depending on the state or even the county.
I have used lagged snapshots to represent the electorate because that’s the data I had on hand, most are from three to seven months after Election Day, and one is 11 months after Election Day. I have saved snapshots from the spring following an election for cases when I want to look at voter turnout, which can take months to update. As a result, the periods of time I’m examining are not exactly equal in length or seasonality. I am working on the assumption that most registration and party-switching activity occurs prior to a primary or general election, so a lagged snapshot will be a better representation than a snapshot from a few months before an election.
| SNAPSHOT DATE | YEAR REPRESENTED |
|---|---|
| 2017-10-10 | 2016 |
| 2018-05-08 | 2017 |
| 2019-03-12 | 2018 |
| 2019-11-12 | 2019 |
| 2021-03-09 | 2020 |
| 2022-01-11 | 2021 |
| 2022-05-17 | 2022 |
Another quirk of our system is that thirty states and the District of Columbia record party registration, and the other states do not. Therefore, if we’re interested in documented party registration, we can only analyze data from these states. Party registration is simply not available in twenty states, including some key battlegrounds like Georgia, Michigan, Wisconsin, Ohio, and Virginia.
In the AP article, the authors use modeled party affiliation to estimate party switching changes in states where party registration does not exist. This is an inappropriate use of modeled partisanship data, because people may vote for another party without changing their affiliation; some people will split the ticket (think Georgia voters who voted for Joe Biden (D) for President and David Perdue (R) for Senate in Nov. 2020). Partisanship models are generally intended to estimate an individual’s propensity toward one party or another so they can be targeted (or not) for persuasion, turnout, or registration efforts. To estimate the number of people who have actually switched their partisan identity from Democrat to Republican (and vice versa), you would need to collect data on that, probably via a survey, to measure an actual change in partisan identity, and then build a model using that data as the dependent variable. To be clear, this is not a critique of the L2 models, but rather criticism of the journalists’ use of that data.
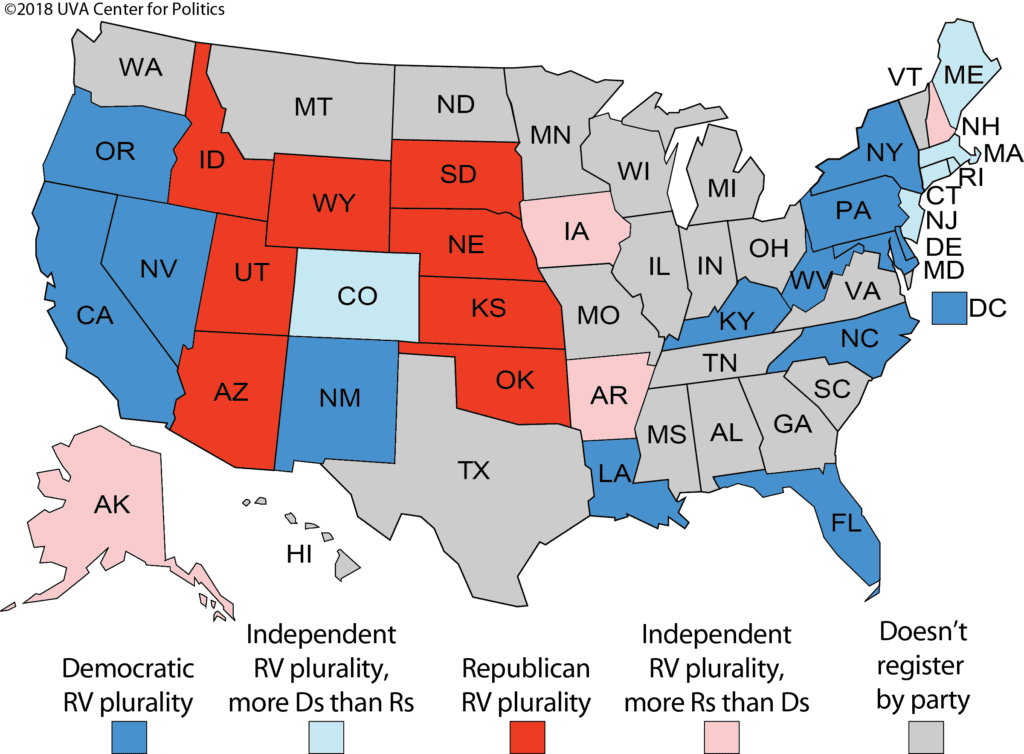
In 2018, the UVA Center for Politics shared this helpful map of party registration by state:
What did I find?
First, from 2020 to 2022, Republicans do, in fact, have an advantage in party-switching in states where data are available. In my analysis, Republicans also had the advantage in party-switching compared to Democrats from 2018 to 2020. And, I found rates were similar from 2016 to 2018. So, looking at the national trend, I don’t see a sudden shift post-2020.
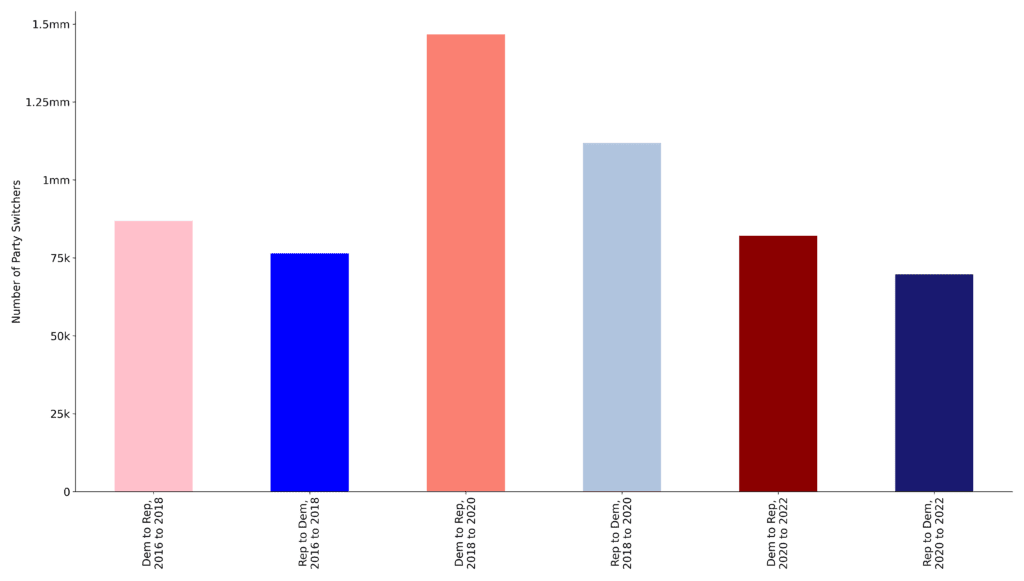
Of all party switchers, from 2018 to 2020, 1.3 million Democrats became Republicans, and from 2020 to 2022, 673 thousand Democrats became Republicans. Compare this to 1.0 million and 570 thousand Republicans who became Democrats from 2018 to 2020 and 2020 to 2022, respectively. The difference in two-way party switchers favored Republicans by 104 thousand from 2016 to 2018, by 267 thousand from 2018 to 2020, and by 103 thousand from 2020 to May 2022.
Party switchers make up a small percentage of all registered voters: from 2016 to 2022, 2 million registered Democrats changed their affiliation to Republican, and 1.5 million registered Republicans changed their affiliation to Democratic. That sounds like a lot, but it’s a combined percentage of only 3.3 percent of all registered voters in the states for which we have data.
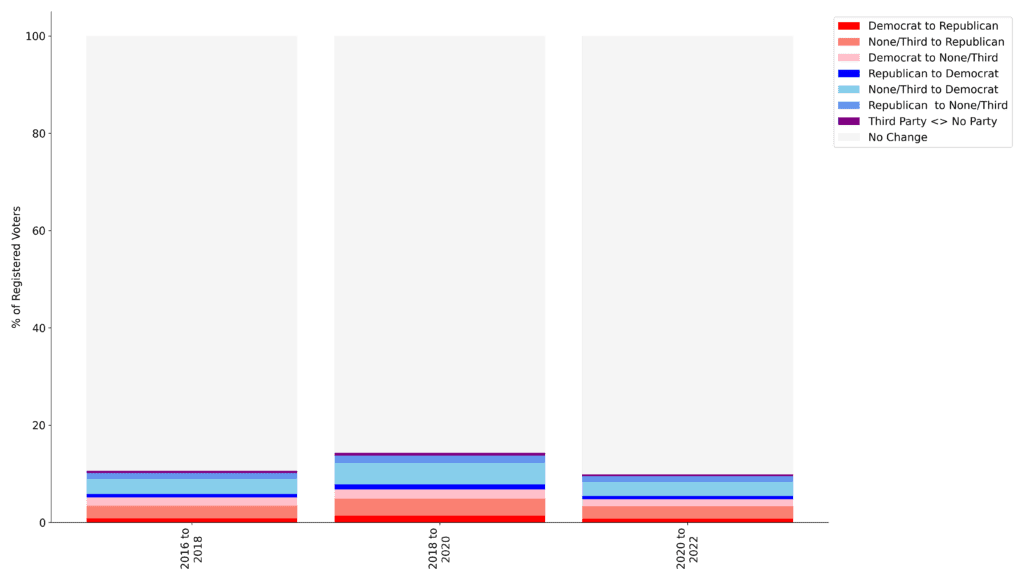
Over the time period in question, between 86 and 90 percent of voters maintained their same party affiliation from year to year. A small share outright changed their affiliation from Democrat to Republican or Republican to Democrat. Voters were more likely to shift from being members of a major party to Third Party or unaffiliated, and vice versa.
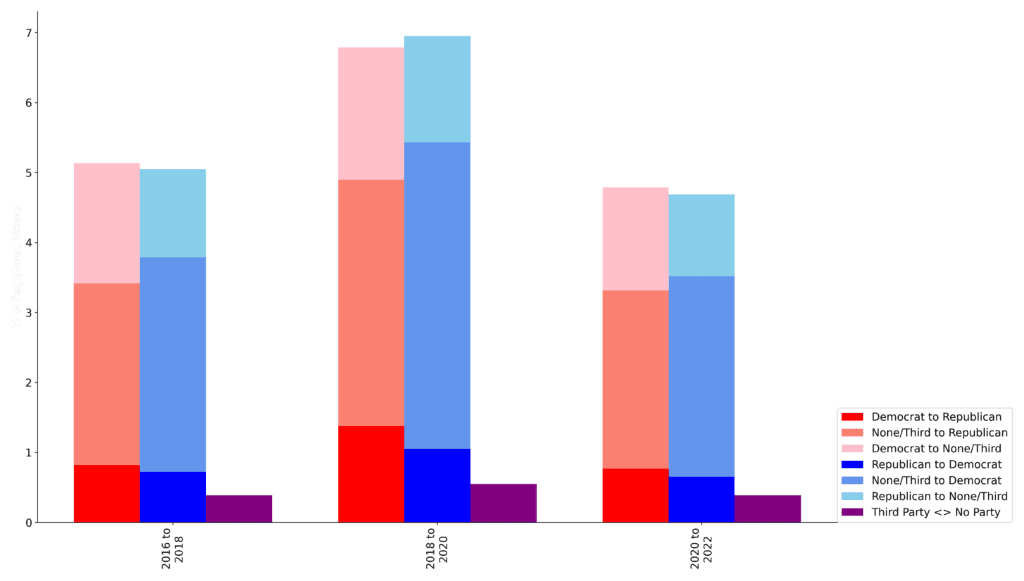
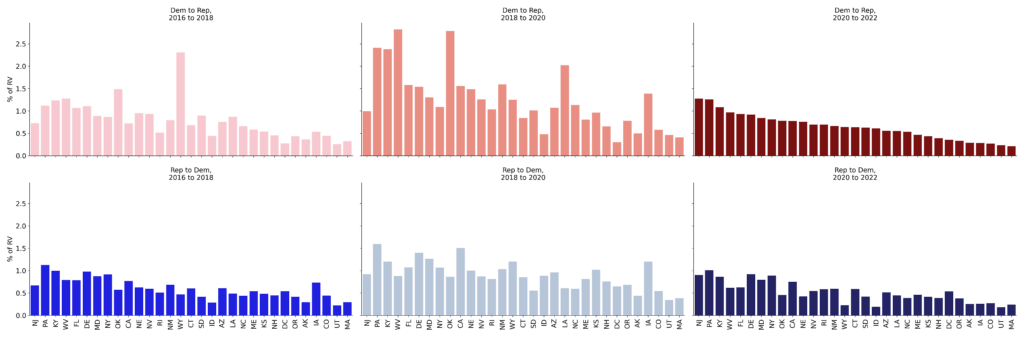
Let’s look within states for a more nuanced picture. In the following plot, I show the number of party switchers by state. Each grid represents roughly a two-year period between one general election and the next.
What stands out? From 2016 to 2018, there was an especially pronounced shift of Democrats to Republicans in Wyoming and Oklahoma. The volume of party switching was higher in both directions from 2018 to 2020, compared to 2016 to 2018 and 2018 to 2020. West Virginia, Oklahoma, Pennsylvania, Kentucky, and Louisiana had the highest share of Democratic-to-Republican party switchers in 2018-2020. Since 2020, there have been fewer party switchers (our data also covers a smaller window of time), with New Jersey and Pennsylvania having the greatest share of Democratic-to-Republican switchers. Still, these states had similar levels of Republican-to-Democratic switchers.
Party switchers are somewhat rare, so we should also take into account the rest of the electorate and the baseline levels of party affiliation. While electoral politics are decided locally and at the state level, it’s fair for journalists to try to see if there are any national trends at work. Let’s see if that notion holds up.
Overall, Democrats still have a net registration advantage of 12.8 million voters, up from 12.3 million in 2016. The Democratic advantage registration peaked at 13.2 million in 2020. This is out of a total 219 million registered voters on the voter file (as of May 2022), of which 166 million voted in the general election (per the voter file), and 159 million voted for president (per reported election results).
This lead is pronounced in the populous states of California and New York, but there’s also a sizable advantage in Pennsylvania (+606 thousand voters).
Next, let’s look at how party affiliation as a whole and how this has changed over time.
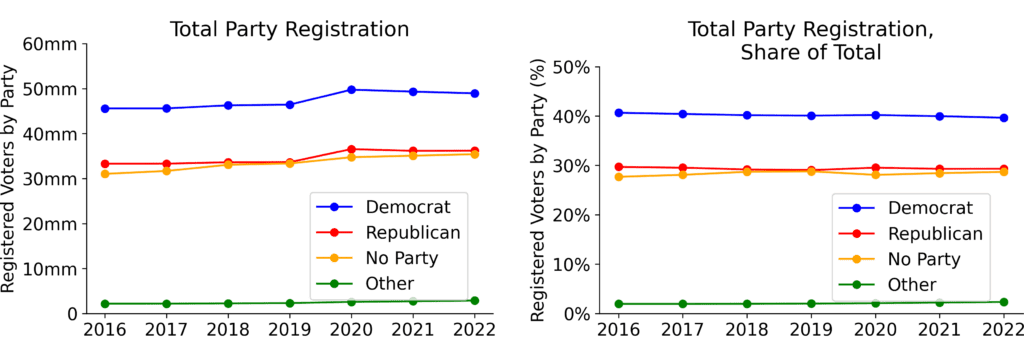
Between 2016 and May 2022, the percentage of all voters who are registered as Democrats varies between 39.7 percent (2022) and 40.7 percent (2016). Current Democratic registration levels are at the lowest for the time in question, about 1 percentage point less than their highest share in 2016.
Between 2016 and May 2022, the percentage of all voters who are registered as Republicans varies between 29.7 percent (2016) and 29.0 percent (2019). As of May 2022, their share of registrants is in the middle, at 29.3 percent.
A one-point difference in overall registration share over a six-year period could be concerning. The difference is not being driven by a decline in party affiliation (there are 3.4 million more registered Democrats now than in 2016) or a steeper rise in Republican affiliation (there are 2.9 million more registered Republicans now than in 2016). The electorate in these states has added 5.1 million registrants who are unaffiliated or members of third parties, and they make up 1.4 percent more of the electorate now (31.0%) compared to 2016 (29.6%).
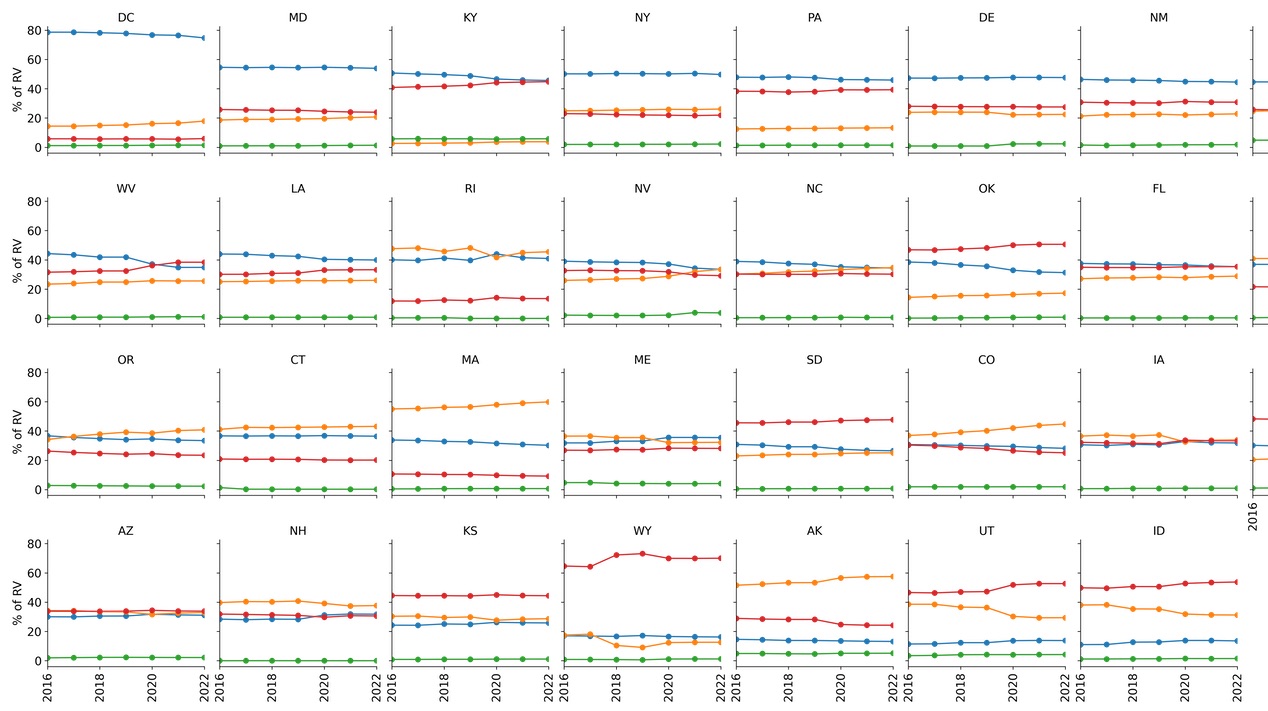
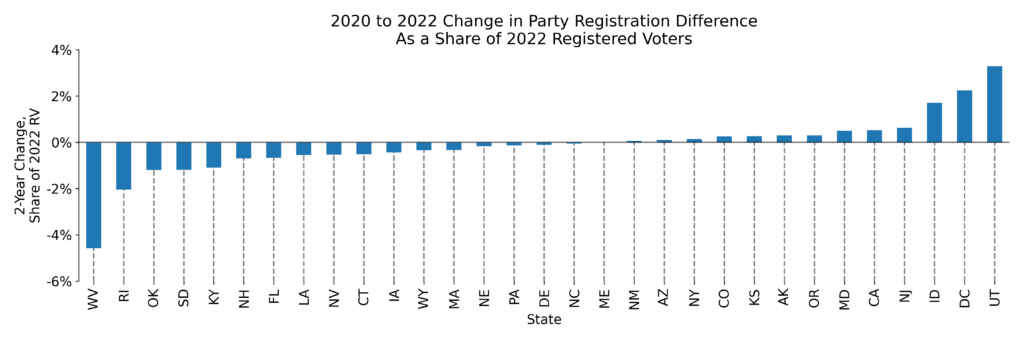
How did these changes vary state by state?
Of course, in electoral politics, it’s the state-by-state dynamics that matter, not national trends. So, state by state, we can see how party affiliation as a share of all registered voters has changed over time.
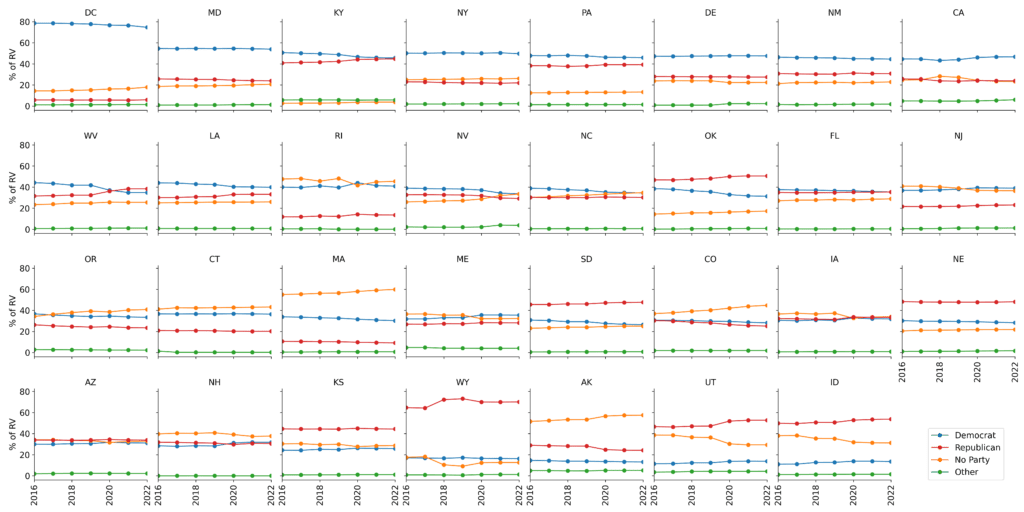
Many states are relatively stable, and some states are worthy of closer inspection.
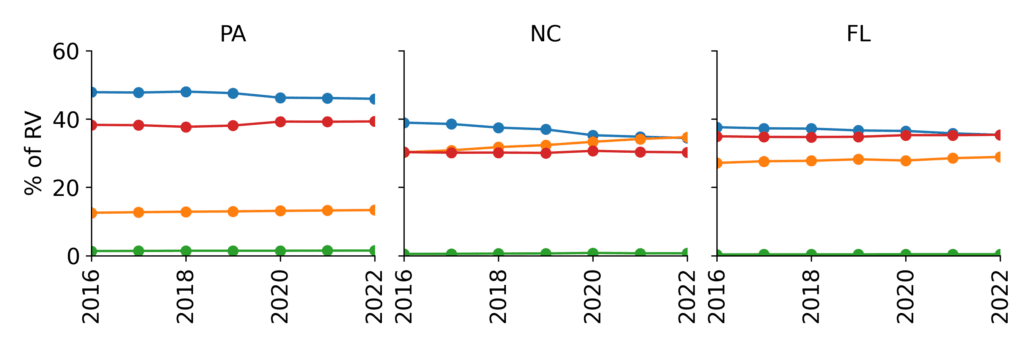
Pennsylvania, Florida, and North Carolina: For Democrats, there are warning signs in these large and competitive states. The narrow Democratic registration advantage is declining. In Florida, as of May 2022, Republicans outnumber Democrats by half of a hundredth of a percent.
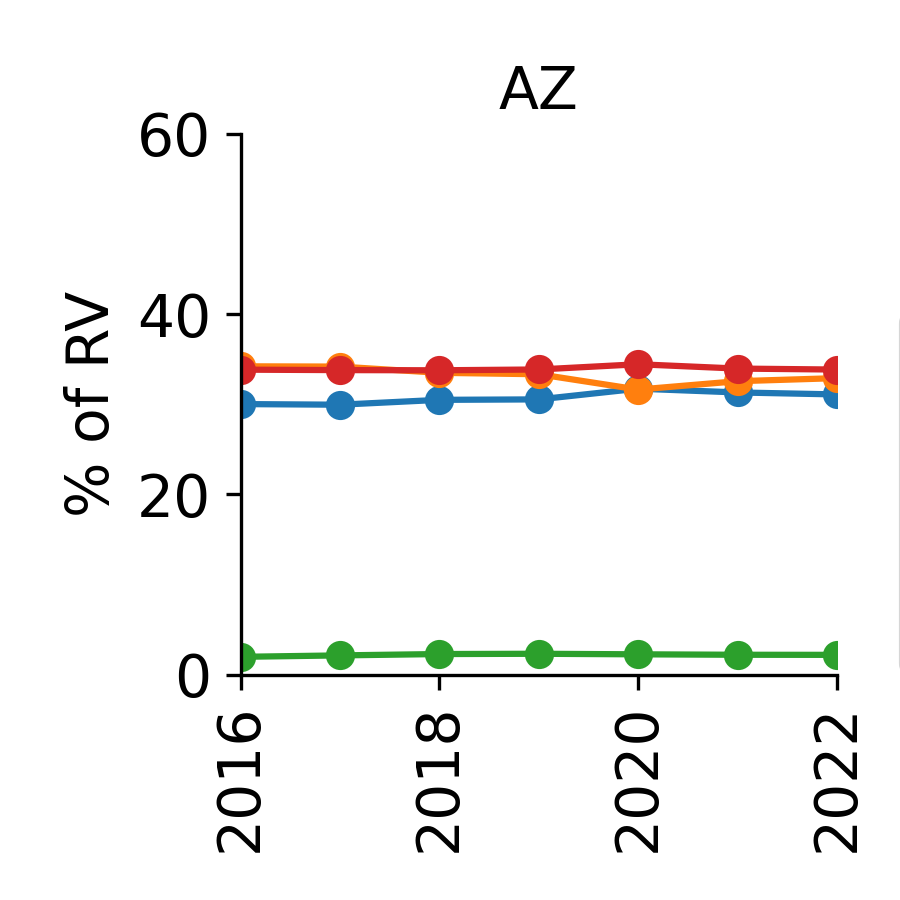
Arizona has a marginal Republican registration advantage, but the difference is narrow and growing tighter. If this continues, Arizona may continue to hold its new status as a battleground state.
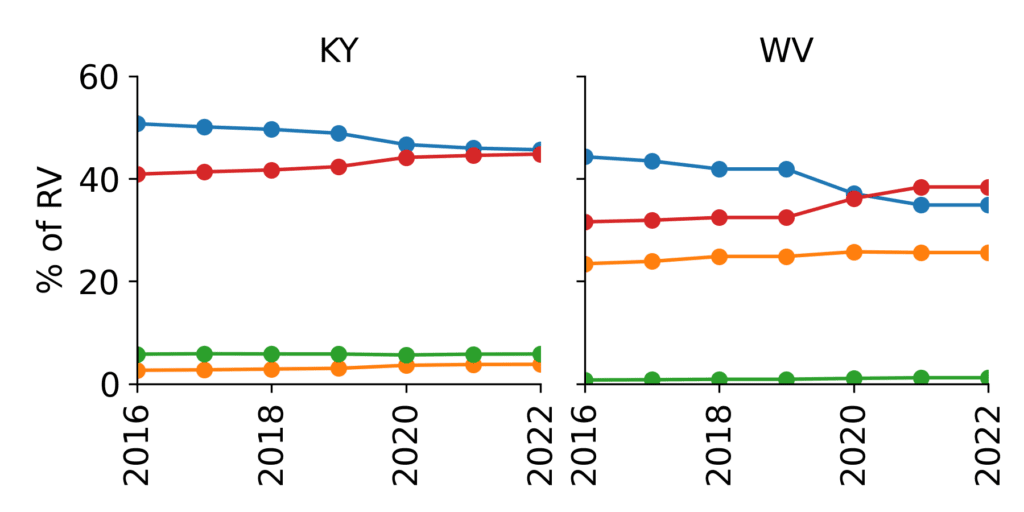
In Kentucky and West Virginia, the share of registered Democrats is falling while the share of registered Republicans is rising. As of 2022, Republicans now outnumber Democrats in West Virginia and are nearly equal in Kentucky. This is not surprising given the cultural and political rightward shift in this region, but it may signal that the days of competitive Kentucky statewide races are in the rearview mirror.
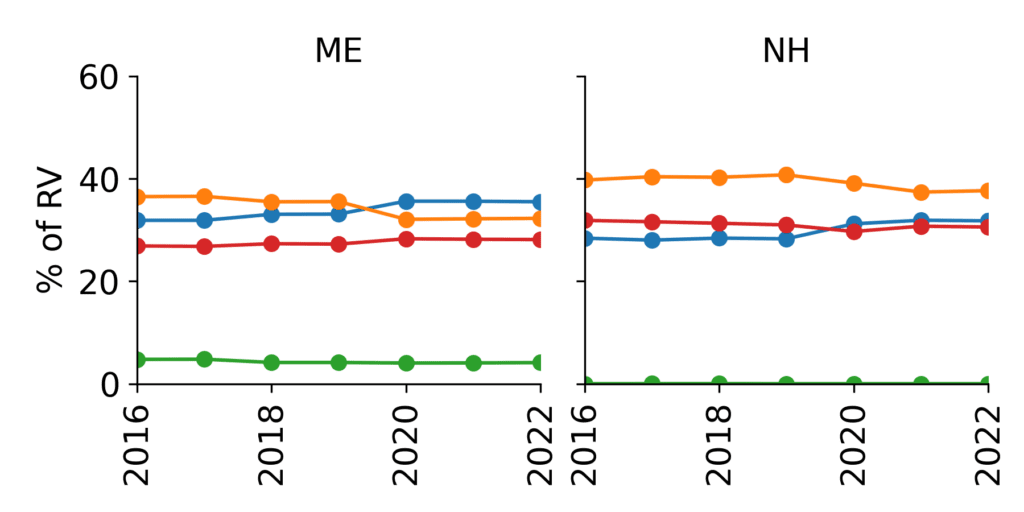
In the competitive New England states of Maine and New Hampshire, the share of registered Democrats is rising. In New Hampshire, Republicans lost their registration advantage between 2018 and 2020. Republicans may have a harder time competing in these states as the national party trends Trumpian.
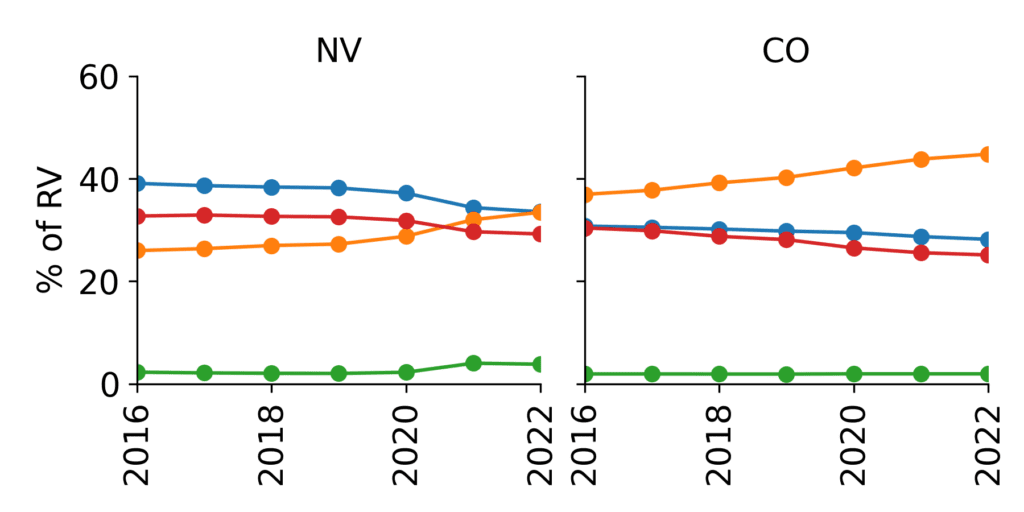
In the competitive south- and mountain West states of Nevada and Colorado, the share of voters registered as Democrats is declining. Put this in the context that the share of registered Republicans is also declining, and the share of unaffiliated voters is on the rise. Democrats are holding their registration advantage in these states, and the future depends on whether this growing share of unaffiliated voters will lean left or right.
So, has there been a notable rightward shift post-2020?
Based solely on party switching, no, I don’t think the data point to a dramatic shift, and I think the AP’s claim that “More than 1 million voters switch to GOP in warning for Dems” is flawed.
Based on the data, the Democratic Party continues to lead total voter registration by a wide margin, but the system — the Senate and the Electoral College — favors Republicans.
Looking within states, the trends vary depending on the local political and cultural context. There is cause for alarm in Pennsylvania, North Carolina, and Florida. But there’s also hope: states like Maine, New Hampshire, Nevada, and Colorado may trend bluer over time if current trends continue.
So, should Democrats be worried about the fall? Of course, but not because of a relatively small number of party switchers.